Data & decisions / 07
public mortgage data
Mortgage market intelligence
Every U.S. metro scored each month from Census, HMDA and FHFA data, ranked by the strategy weights you choose.
The decisionWhich U.S. markets a mortgage business should grow in, and why.
01 / Overview
The problem, and the approach.
AThe challenge
Decisions about where to grow often rest on anecdote or a single metric, while the public data that could inform them sits in three agencies’ formats.
BThe approach
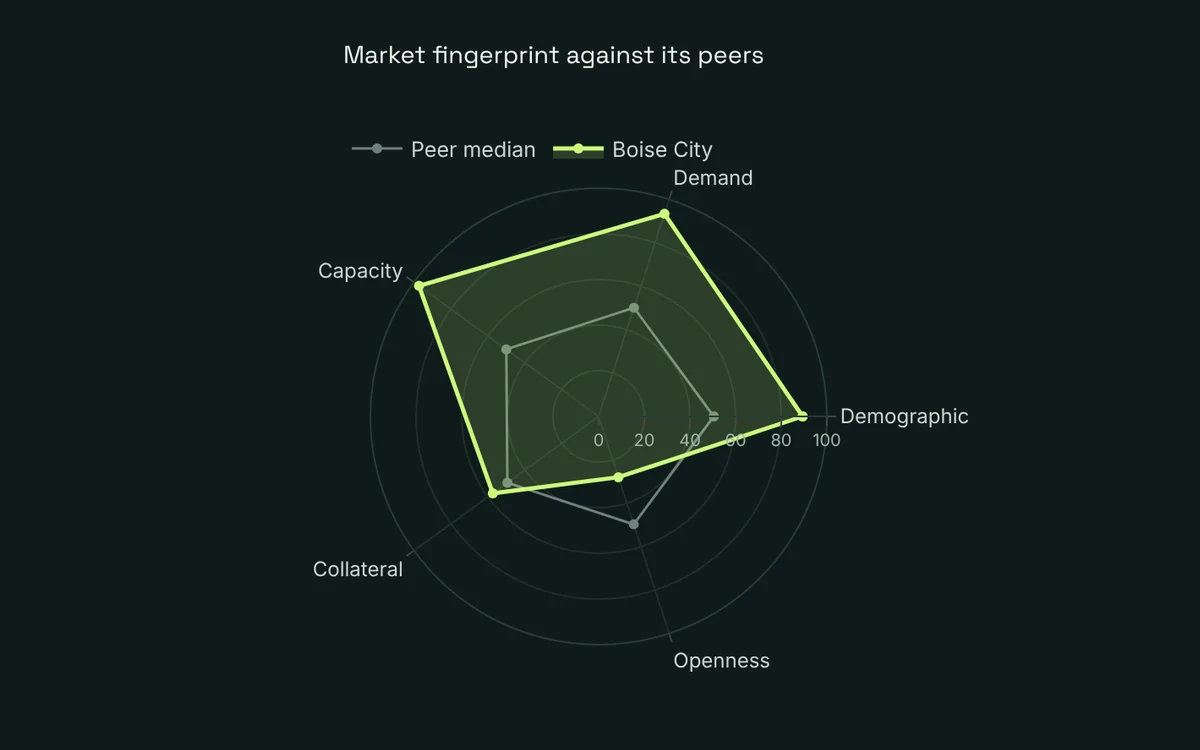
A scheduled pipeline pulls Census, HMDA and FHFA data each month and scores 380+ metro markets on five pillars. You set the strategy weights and the rankings rebuild; PCA and K-means group markets into named archetypes, lender shares show who already competes, and an anomaly score flags markets that stand out.
02 / The decision journey
5 decisions, one story.
Each stage asks one business question and answers it with a model you can open and change. Any card opens that stage of the live demo.
-
 01
Score
Where is the mortgage market opening up?
Five pillars, your own strategy weights, rankings that rebuild on the spot.
Open this stage
01
Score
Where is the mortgage market opening up?
Five pillars, your own strategy weights, rankings that rebuild on the spot.
Open this stage
-
 02
Archetypes
Which markets behave alike?
PCA and K-means group metros into archetypes with plain-English names.
Open this stage
02
Archetypes
Which markets behave alike?
PCA and K-means group metros into archetypes with plain-English names.
Open this stage
-
 03
Lenders
Who already competes there?
HMDA lender shares and competitive openness, market by market.
Open this stage
03
Lenders
Who already competes there?
HMDA lender shares and competitive openness, market by market.
Open this stage
-
 04
Brief
What should a leader know about one market?
A grounded brief written from that market’s own numbers.
Open this stage
04
Brief
What should a leader know about one market?
A grounded brief written from that market’s own numbers.
Open this stage
-
 05
Signals
Which markets look unusual?
Gaps between demand and lending, and an anomaly score for markets that stand out.
Open this stage
05
Signals
Which markets look unusual?
Gaps between demand and lending, and an anomaly score for markets that stand out.
Open this stage
03 / Under the hood
How it’s built.
Algorithms
- PCA
- K-means
- Composite scoring
- Anomaly detection
Stack
- Python
- pandas
- scikit-learn (PCA, K-means)
- Scheduled pipeline
- Plotly
- Streamlit
Methods, in order
- Scheduled pipeline
- Composite scoring
- Clustering
- Lender benchmarking
- Anomaly detection
- Grounded Q&A
Data
Public data only: Census ACS, HMDA and the FHFA house price index.
04 / Outcomes
What it changed.
- 01
380+ U.S. metro markets scored every month without manual work.
- 02
Market archetypes with plain-English names a leader can use.
- 03
A grounded brief for any market, written from that market’s own numbers.
Results come from synthetic or public data with known answers. They show the method, not a client result.
05 / Try it
The live demo.
The real app, running on synthetic data. Change the inputs and watch the decision move.
Interactive, synthetic data. If nobody has used it for a while it takes about 30 seconds to wake.
Open in a new tab ↗06 / Related
Keep exploring.
 Data & decisions / 08
Mortgage product strategy
Where should a lender expand? Public market data, weights you set, a stress-tested ranking and an executive brief that writes itself.
View project
Data & decisions / 08
Mortgage product strategy
Where should a lender expand? Public market data, weights you set, a stress-tested ranking and an executive brief that writes itself.
View project
 Interactive lab / 01
Lending decision lab
A fictional credit union and 50,000 synthetic members, followed through nine connected lending decisions: who to approve, what to charge, who will leave, and whether it is all fair.
View project
Interactive lab / 01
Lending decision lab
A fictional credit union and 50,000 synthetic members, followed through nine connected lending decisions: who to approve, what to charge, who will leave, and whether it is all fair.
View project
 Applied AI / 04
Credit policy assistant
Answers from a lending policy manual with every claim cited, and weak matches declined instead of guessed.
View project
Applied AI / 04
Credit policy assistant
Answers from a lending policy manual with every claim cited, and weak matches declined instead of guessed.
View project
Open conversations