Data & decisions / 05
causal inference
Causal impact lab
Two programs that were never randomized. The naive read gets the sign wrong; three causal methods recover the true effect.
The decisionDid a program work when nobody ran an experiment, and which estimate should the business act on?
01 / Overview
The problem, and the approach.
AThe challenge
Most programs are never randomized: managers choose where to launch, and customers choose whether to join. A dashboard comparison then mixes the program’s effect with who received it, and can point in the wrong direction.
BThe approach
A loyalty price lock launched in eight manager-chosen markets and an opt-in autopay discount, with a true effect planted in the synthetic data. Difference-in-differences with an event study, a demeaned synthetic control checked with placebo runs, and propensity matching and weighting, each scored against the truth, with E-values for what unmeasured confounding could still do.
02 / The decision journey
5 decisions, one story.
Each stage asks one business question and answers it with a model you can open and change. Any card opens that stage of the live demo.
-
 01
Frame
What does the dashboard say?
Both naive comparisons say the program raised churn. It cut it.
Open this stage
01
Frame
What does the dashboard say?
Both naive comparisons say the program raised churn. It cut it.
Open this stage
-
 02
Diff-in-diff
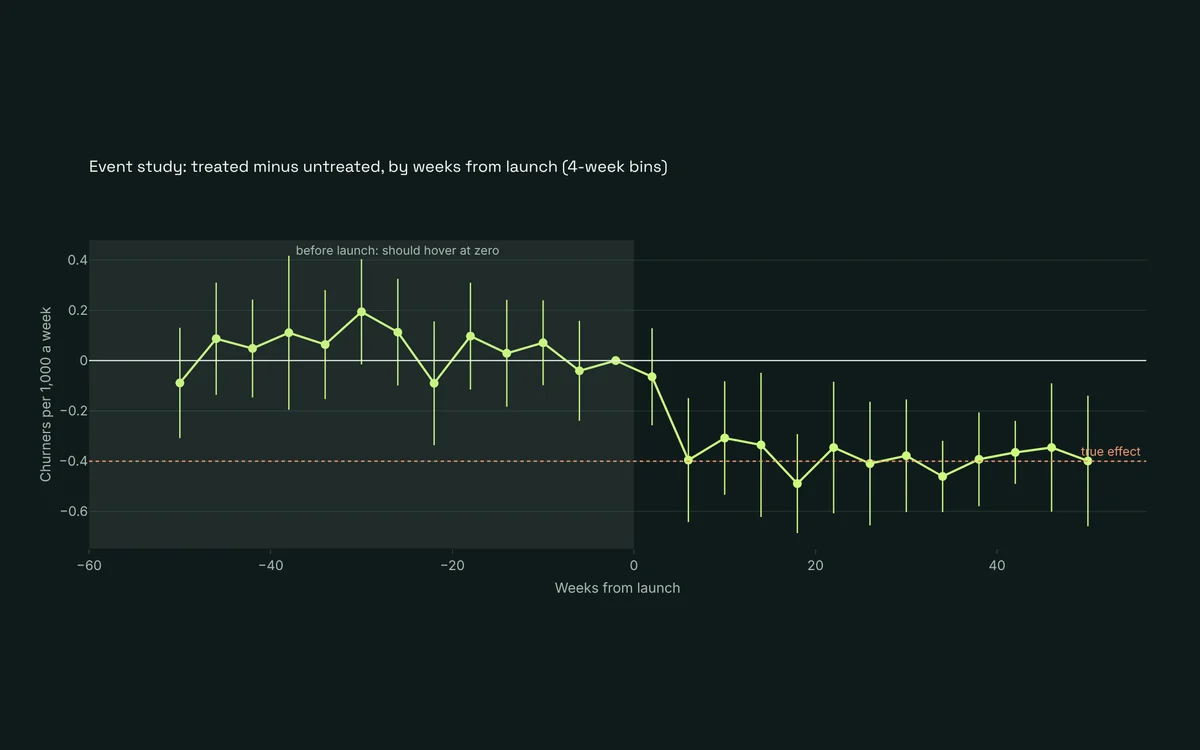
Did the treated markets change more?
Within 0.03 of the truth, with the event study that earns the trust.
Open this stage
02
Diff-in-diff
Did the treated markets change more?
Within 0.03 of the truth, with the event study that earns the trust.
Open this stage
-
 03
Synthetic control
What would have happened without it?
A weighted twin of untreated markets, checked with placebo runs.
Open this stage
03
Synthetic control
What would have happened without it?
A weighted twin of untreated markets, checked with placebo runs.
Open this stage
-
 04
Matching
Did the discount work, or did loyal customers join?
Matching removes measured differences, and a toggle shows what it cannot.
Open this stage
04
Matching
Did the discount work, or did loyal customers join?
Matching removes measured differences, and a toggle shows what it cannot.
Open this stage
-
 05
Decide
Which number goes to the business?
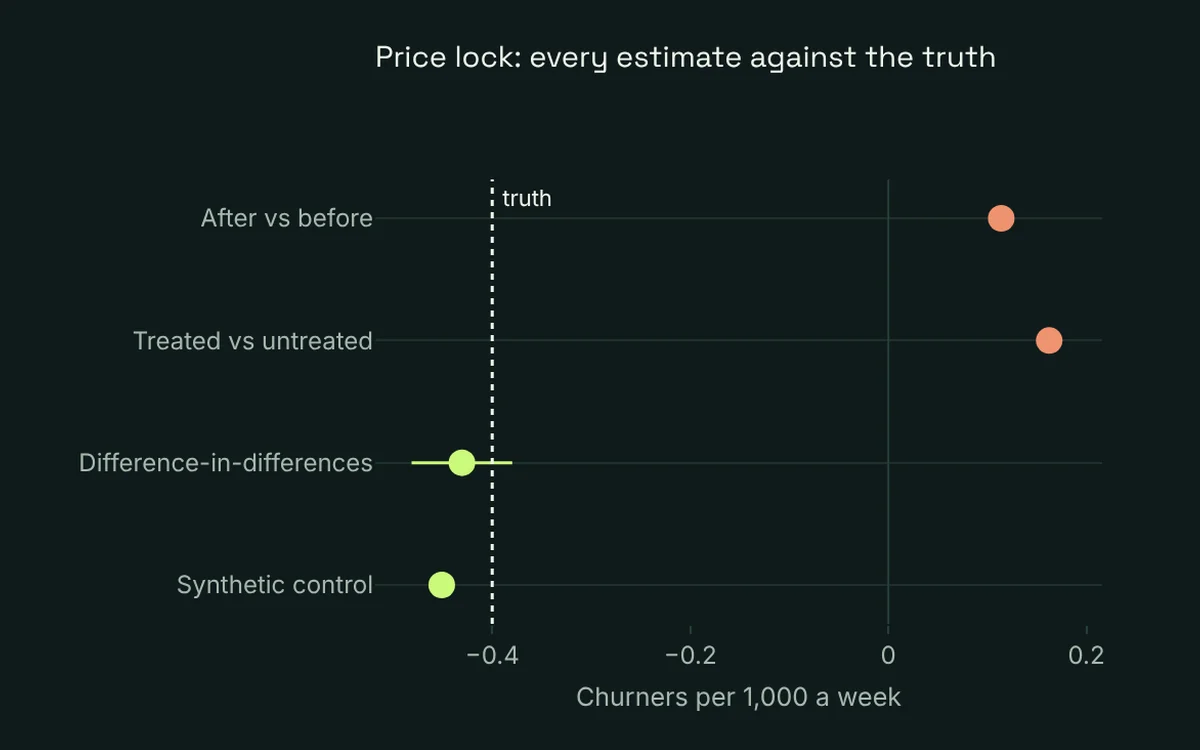
Every estimate against the truth, and a rule for choosing among them.
Open this stage
05
Decide
Which number goes to the business?
Every estimate against the truth, and a rule for choosing among them.
Open this stage
03 / Under the hood
How it’s built.
Algorithms
- Two-way fixed effects
- Event study
- Synthetic control
- Propensity scores (logistic)
- Nearest-neighbor matching
- Inverse probability weighting
Stack
- Python
- NumPy · pandas
- Fixed-effects regression
- scikit-learn (propensity)
- Plotly
- Streamlit
Methods, in order
- Difference-in-differences
- Event study
- Synthetic control
- Placebo tests
- Propensity matching
- E-values
Data
Synthetic weekly churn for treated and untreated markets, with a known effect of −0.40.
04 / Outcomes
What it changed.
- 01
The naive comparison said +0.16: the program looked harmful.
- 02
Difference-in-differences recovered −0.43 against a true −0.40.
- 03
A rule for which estimate goes to the business, and what each method cannot fix.
Results come from synthetic or public data with known answers. They show the method, not a client result.
05 / Try it
The live demo.
The real app, running on synthetic data. Change the inputs and watch the decision move.
Interactive, synthetic data. If nobody has used it for a while it takes about 30 seconds to wake.
Open in a new tab ↗06 / Related
Keep exploring.
 Data & decisions / 06
Marketing mix optimizer
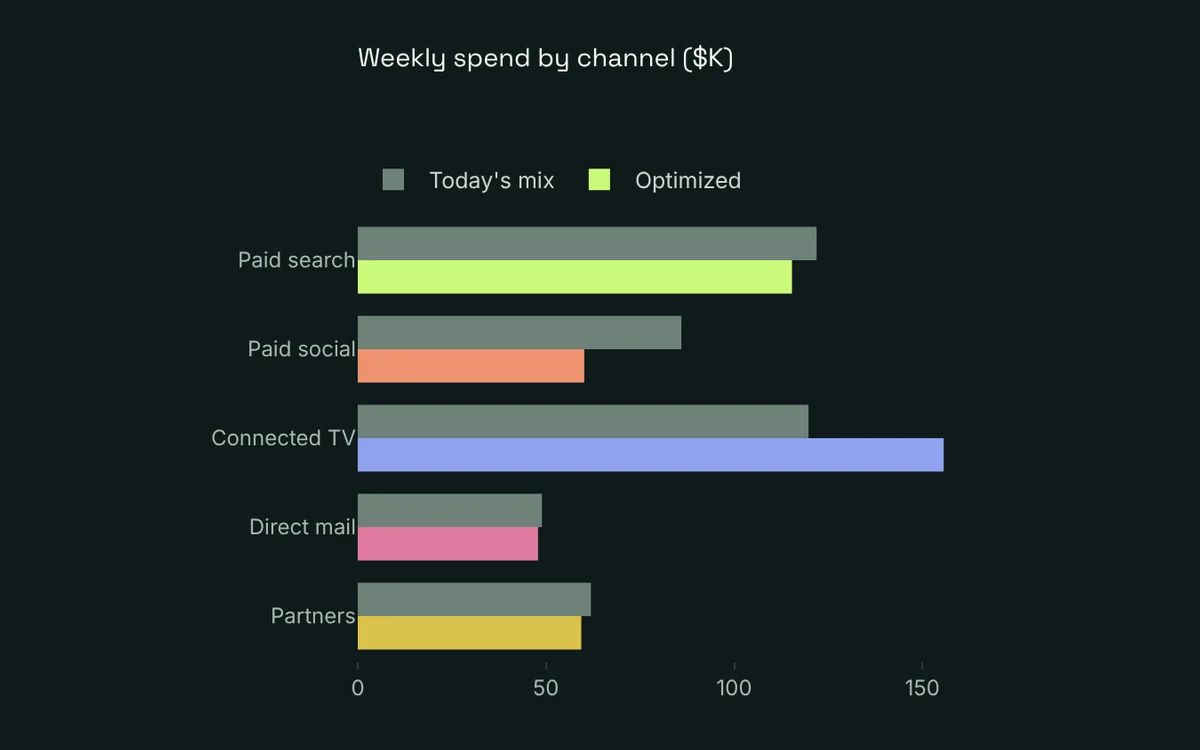
A mix model with carryover and saturation, calibrated to a geo test, moves the same budget to where it earns the most.
View project
Data & decisions / 06
Marketing mix optimizer
A mix model with carryover and saturation, calibrated to a geo test, moves the same budget to where it earns the most.
View project
 Interactive lab / 02
Subscriber value lab
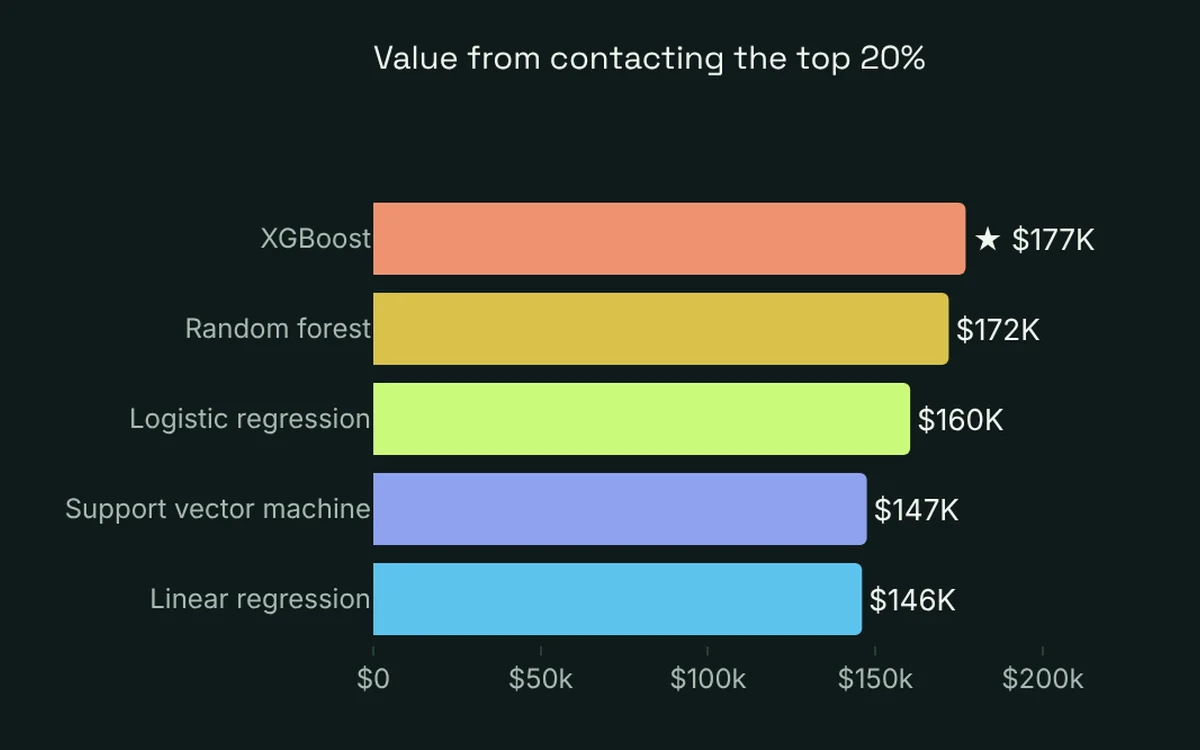
A fictional internet and mobile provider with 60,000 subscribers: who will leave, who an offer actually saves, and how far prices can rise.
View project
Interactive lab / 02
Subscriber value lab
A fictional internet and mobile provider with 60,000 subscribers: who will leave, who an offer actually saves, and how far prices can rise.
View project
 Applied AI / 03
Analytics copilot
Ask the warehouse a question in plain English and get governed SQL, a chart and a one-line answer, or an honest decline.
View project
Applied AI / 03
Analytics copilot
Ask the warehouse a question in plain English and get governed SQL, a chart and a one-line answer, or an honest decline.
View project
Open conversations