Interactive lab / 02
customer value & retention
Subscriber value lab
A fictional internet and mobile provider with 60,000 subscribers: who will leave, who an offer actually saves, and how far prices can rise.
The decisionWhich customers to save, with what offer, how far to raise prices, and how to prove any of it worked.
01 / Overview
The problem, and the approach.
AThe challenge
Subscription businesses spend heavily on retention offers, usually aimed at the customers most likely to leave. Many of them leave anyway, and others would have stayed without the discount, so the budget pays for outcomes it did not change.
BThe approach
Corvane Connect, a fictional internet and mobile provider with 60,000 synthetic consumer and small-business subscribers. Lifetime value from a discrete-time survival model, a five-algorithm churn bench, uplift learned from a randomized retention campaign, price response learned from a randomized price test, experiment design with CUPED, a care-note classifier, and a one-page brief for leadership.
02 / The decision journey
9 decisions, one story.
Each stage asks one business question and answers it with a model you can open and change. Any card opens that stage of the live demo.
-
 01
Trends
What is happening to the base?
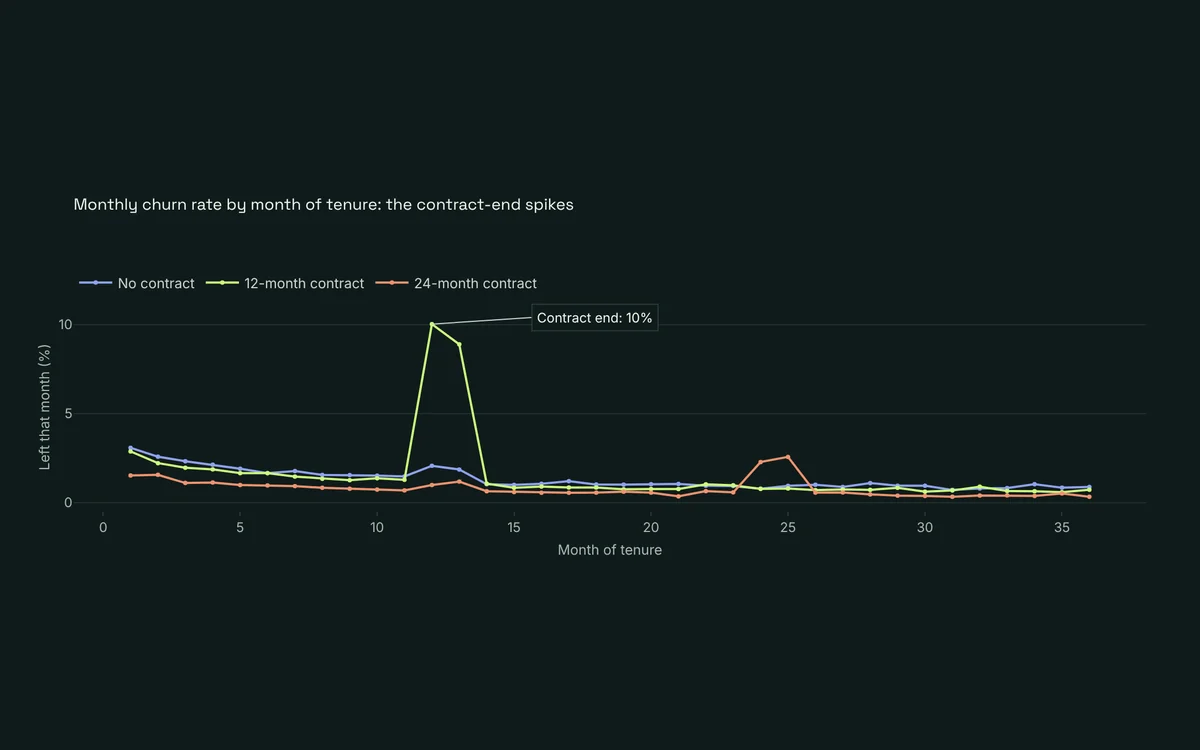
Churn is a calendar, not a constant: it spikes when contracts and promotions end.
Open this stage
01
Trends
What is happening to the base?
Churn is a calendar, not a constant: it spikes when contracts and promotions end.
Open this stage
-
 02
Value
What is each customer worth?
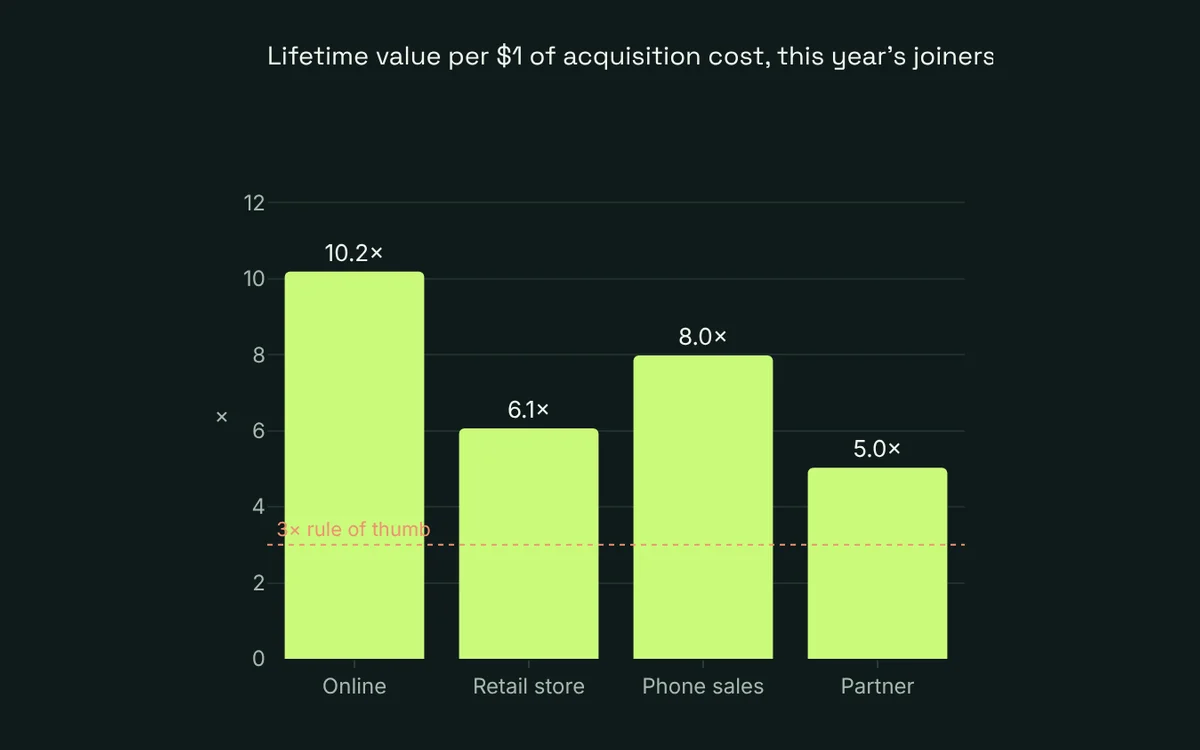
Lifetime value from a survival model, per acquisition dollar and with upgrades.
Open this stage
02
Value
What is each customer worth?
Lifetime value from a survival model, per acquisition dollar and with upgrades.
Open this stage
-
 03
Segment
Who are our customers, and what does each need?
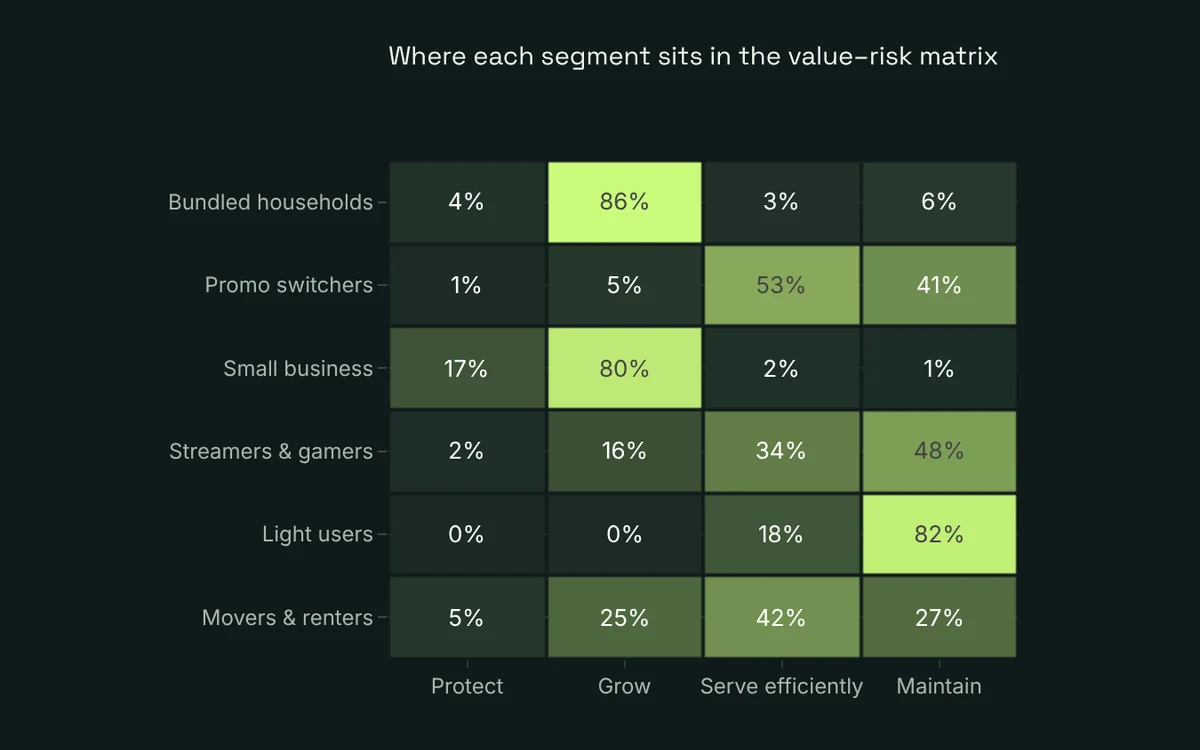
Six segments and the value–risk matrix that turns them into action.
Open this stage
03
Segment
Who are our customers, and what does each need?
Six segments and the value–risk matrix that turns them into action.
Open this stage
-
 04
Churn
Who is about to leave?
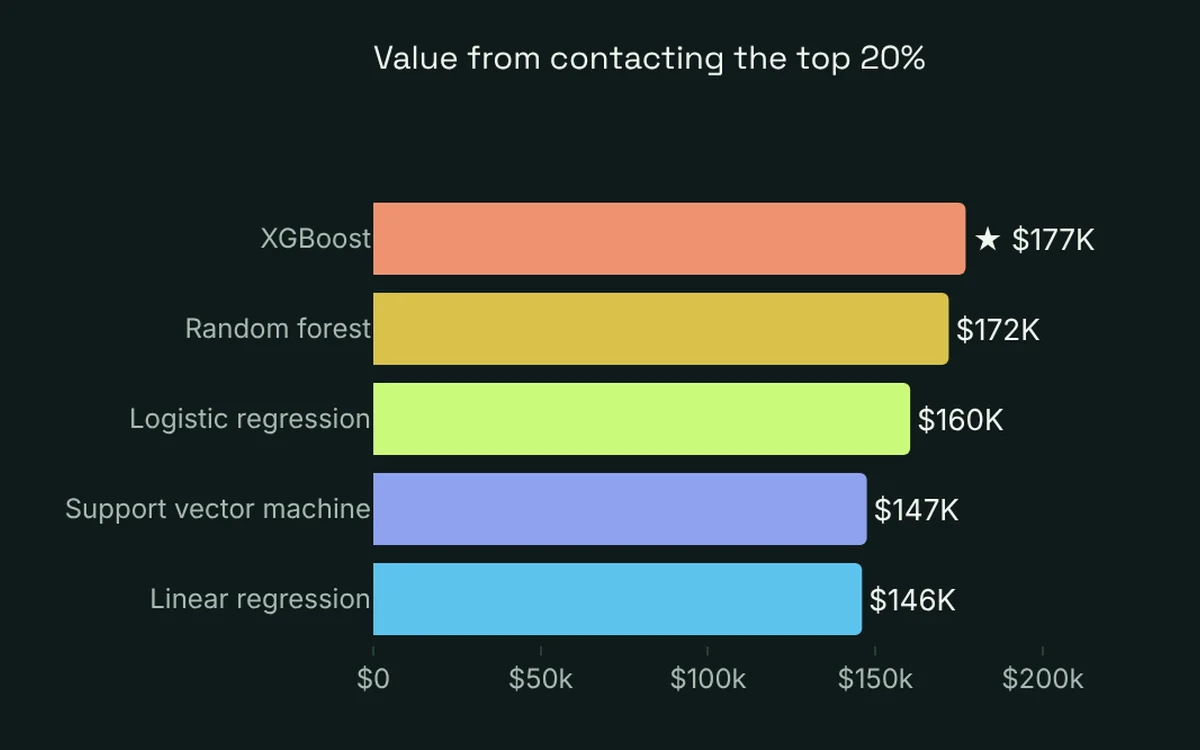
XGBoost wins a five-algorithm bench, because this decision does not need exact reasons.
Open this stage
04
Churn
Who is about to leave?
XGBoost wins a five-algorithm bench, because this decision does not need exact reasons.
Open this stage
-
 05
Treat
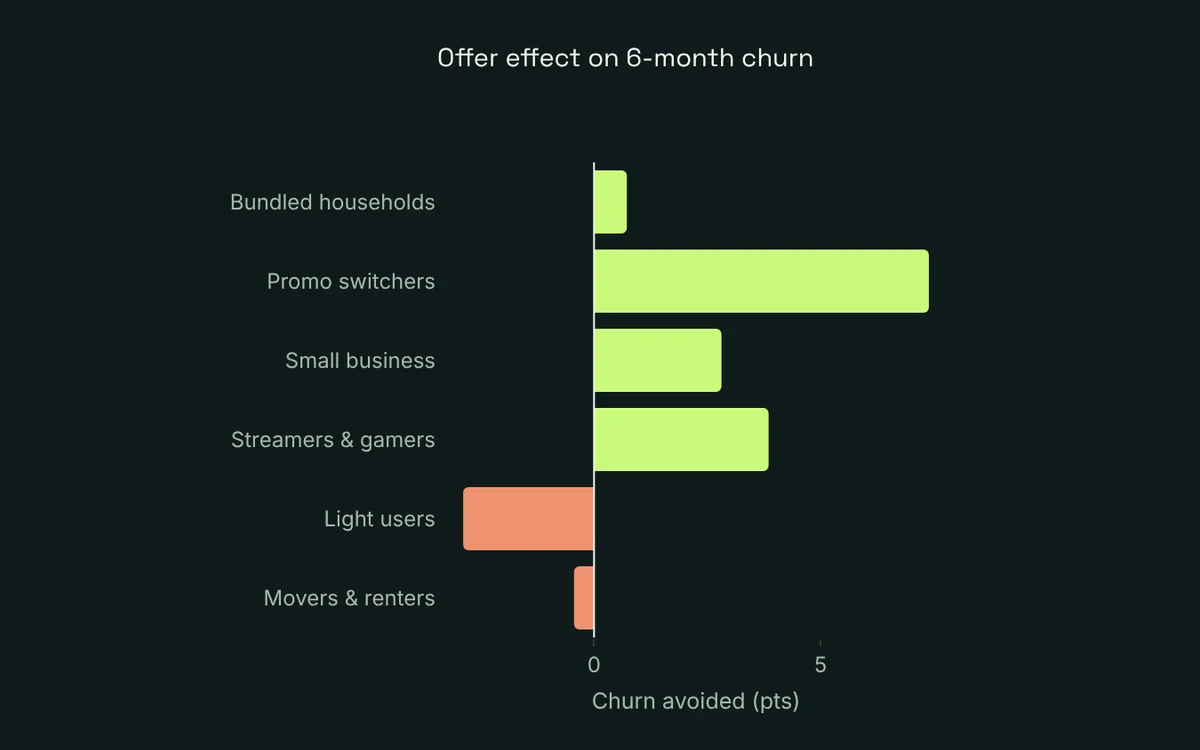
Who does an offer actually save?
Same 5,000 offers: $339K net by uplift and value, −$297K by risk.
Open this stage
05
Treat
Who does an offer actually save?
Same 5,000 offers: $339K net by uplift and value, −$297K by risk.
Open this stage
-
 06
Price
How far can prices rise, and for whom?
Segment increases learned from a randomized test, with guardrails worth $201K.
Open this stage
06
Price
How far can prices rise, and for whom?
Segment increases learned from a randomized test, with guardrails worth $201K.
Open this stage
-
 07
Test
How do we know it worked?
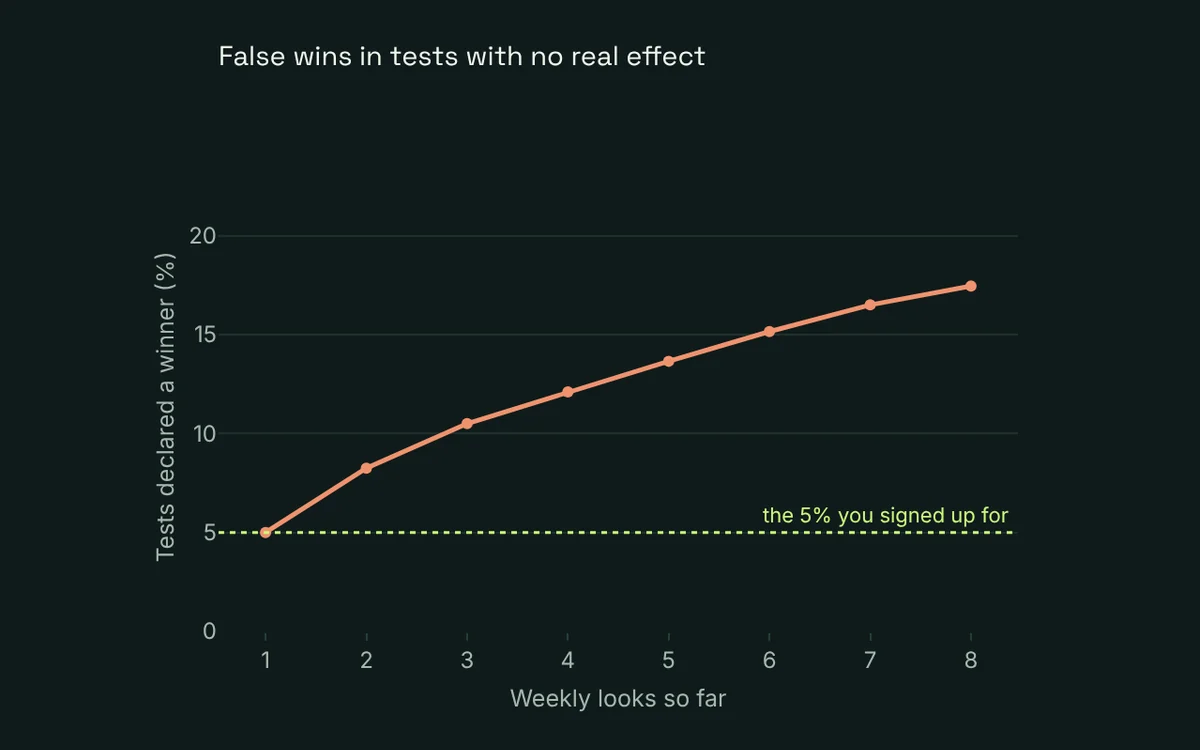
Sample sizes with CUPED, a funnel readout, and why weekly peeking makes false winners.
Open this stage
07
Test
How do we know it worked?
Sample sizes with CUPED, a funnel readout, and why weekly peeking makes false winners.
Open this stage
-
 08
Care
What are customers telling us?
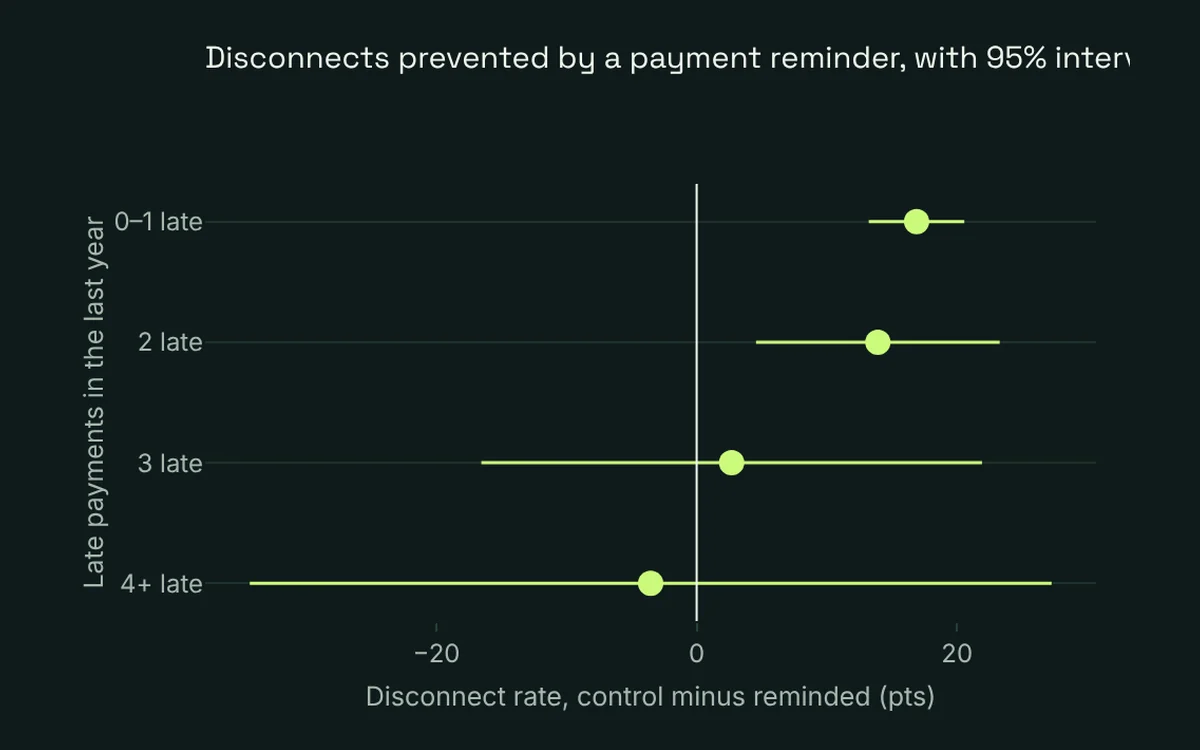
A care-note classifier and a randomized payment-reminder test.
Open this stage
08
Care
What are customers telling us?
A care-note classifier and a randomized payment-reminder test.
Open this stage
-
 09
Brief
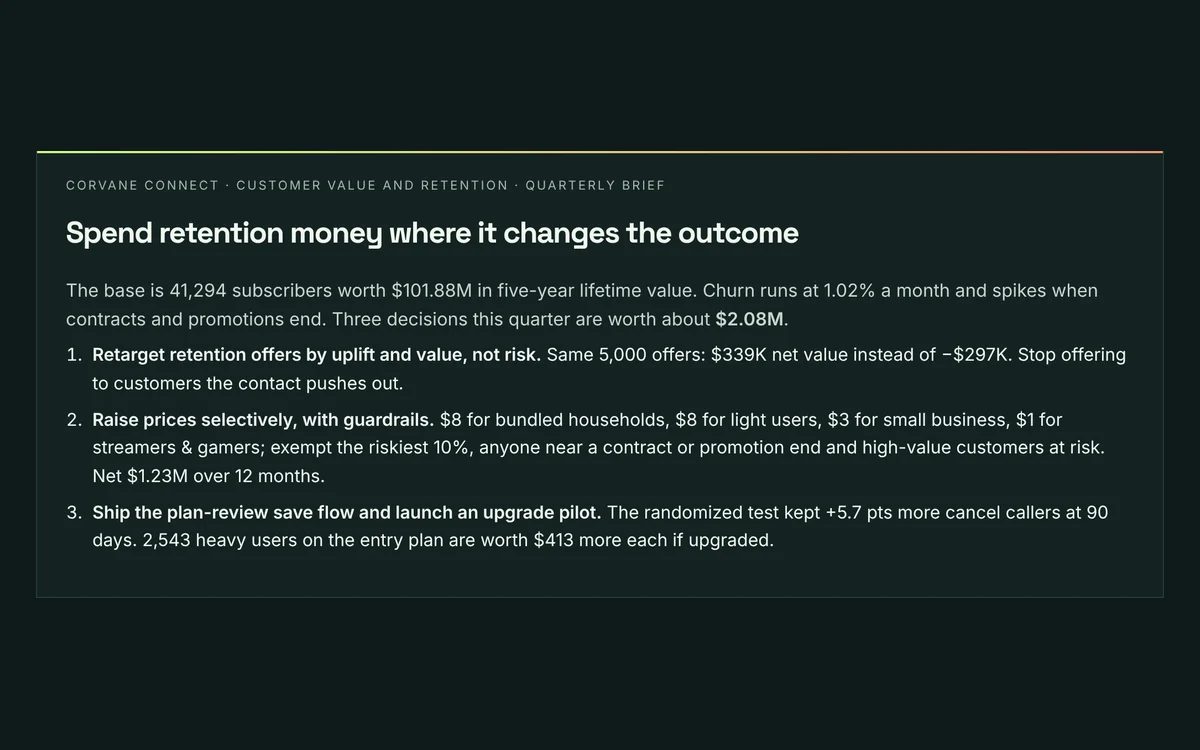
What should leadership decide?
A model inventory and a one-page executive brief, downloadable.
Open this stage
09
Brief
What should leadership decide?
A model inventory and a one-page executive brief, downloadable.
Open this stage
03 / Under the hood
How it’s built.
Algorithms
- XGBoost
- Logistic regression
- Random forest
- Support vector machine
- Linear regression
- K-means
- Survival analysis
- Uplift modeling
- TF-IDF classifier
Stack
- Python
- XGBoost
- scikit-learn
- Survival models
- Plotly
- Streamlit
Methods, in order
- Cohorts
- Lifetime value
- Segmentation
- Churn propensity
- Uplift
- Price response
- Experiment design
- Text classification
- Executive brief
Data
60,000 synthetic subscribers with a randomized price test and a randomized retention campaign built in.
04 / Outcomes
What it changed.
- 01
The same 5,000 offers: $339K net when targeted by uplift and value, −$297K when targeted by churn risk.
- 02
Price increases set by segment from a randomized test, with guardrails worth $201K.
- 03
Weekly peeking shown to manufacture false winners, and CUPED shown to cut the sample a test needs.
Results come from synthetic or public data with known answers. They show the method, not a client result.
05 / Try it
The live demo.
The real app, running on synthetic data. Change the inputs and watch the decision move.
Interactive, synthetic data. If nobody has used it for a while it takes about 30 seconds to wake.
Open in a new tab ↗06 / Related
Keep exploring.
 Applied AI / 03
Analytics copilot
Ask the warehouse a question in plain English and get governed SQL, a chart and a one-line answer, or an honest decline.
View project
Applied AI / 03
Analytics copilot
Ask the warehouse a question in plain English and get governed SQL, a chart and a one-line answer, or an honest decline.
View project
 Data & decisions / 05
Causal impact lab
Two programs that were never randomized. The naive read gets the sign wrong; three causal methods recover the true effect.
View project
Data & decisions / 05
Causal impact lab
Two programs that were never randomized. The naive read gets the sign wrong; three causal methods recover the true effect.
View project
 Data & decisions / 06
Marketing mix optimizer
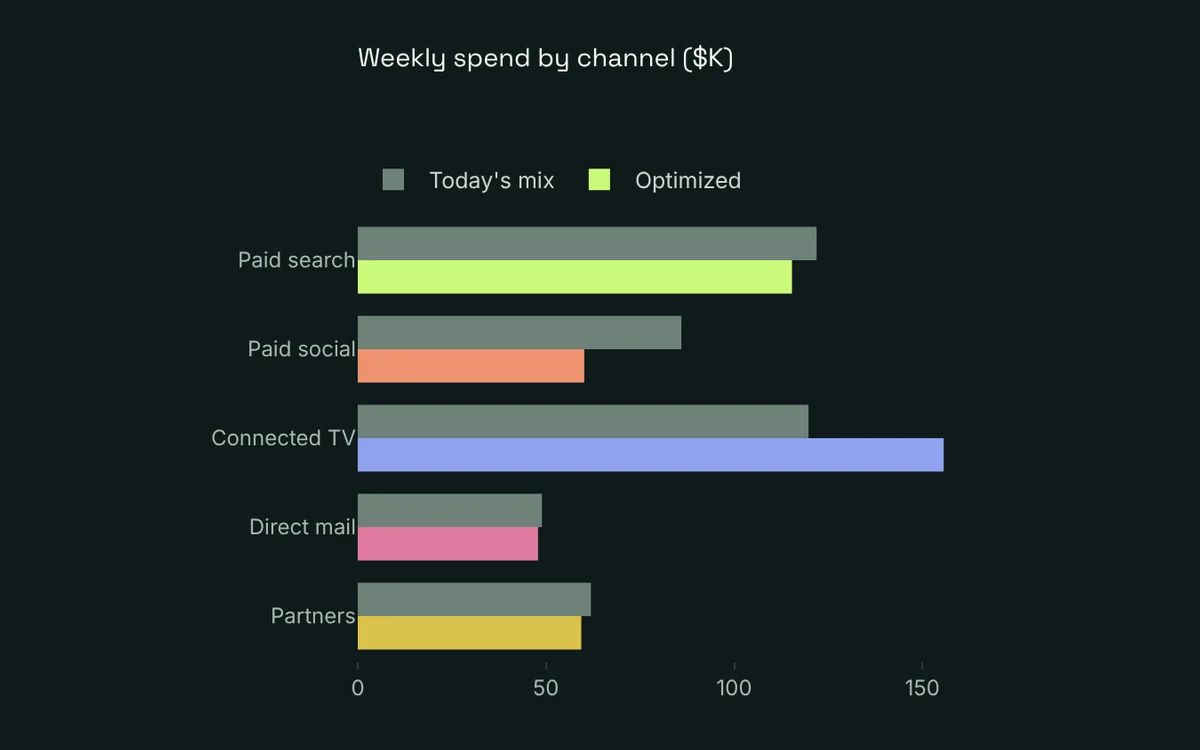
A mix model with carryover and saturation, calibrated to a geo test, moves the same budget to where it earns the most.
View project
Data & decisions / 06
Marketing mix optimizer
A mix model with carryover and saturation, calibrated to a geo test, moves the same budget to where it earns the most.
View project
Open conversations